

Microsoft Excel and its usage in Call Center
Microsoft keeps on producing various applications to provide a pleasing experience to each of its users. MS Word, Excel, and PowerPoint are some of the most popular Microsoft applications. Regardless of industry, Excel is one of the most widely used Microsoft applications.
 |
| Microsoft Excel and its usage in Call Center |
Especially in the Call center industry where the client is very demanding and may ask for data or a dashboard anytime hence if you are in a leadership role you should be skilled enough to prepare the report.
Though every call center has a dedicated MIS team/person to prepare the report but in some circumstances, a team leader also needs to prepare the report. Nowadays excel is a necessary requirement not in a call center but in other industries as well, especially when you are in a leadership role.
In today's blog, we will look into the typical usage of Microsoft in a Call Center.
But before jumping into the main topic let's understand what is MS excel?
What is Microsoft Excel?
Microsoft Excel is a spreadsheet application that is commonly used to prepare performance reports, and dashboards, and to perform data analysis. Finance, Banking, and BPOs are some top industries that use excel the most.
If you are in a leadership position in BPO then understanding excel becomes more imperative. Below are some basic formulas/functions one must know:
- V LOOKUP
- SUM/COUNT IF/IFS
- PIVOT
- BASIC MATH FORMULAS (SUM, COUNT, PRODUCT, AVERAGE).
Typical Usage of MS Excel In Call Center
Although there are numerous uses of MS Excel which also varies as per the industry requirement, however in call centers below 5 usages are very common.
Also Read: Commonly used MS tools in Call Center
1. Preparing Reports/Dashboards:
Excel is broadly used to prepare reports and dashboards. Especially in the call center industry where the client is more focused on performance, he may ask you to share the performance trend or the status of the data given by him to churn.
With the help of excel, anyone can prepare reports and performance dashboards highlighting outlier and performer experts. Not only clients but internal stakeholders may also require regular reports and dashboards to review the performance trend which is possible with the help of excel only.
2. Data Analysis:
One of the major use cases of Microsoft excel is Data Analysis. Although nowadays there are many analysis tools available in the market such as Python, R, Power BI, Tableau, etc.But before these tools became noted, Excel was the only prominent software to perform data analysis.
What is Cluster Analysis in Call Center
Excel provides features such as 'what-if analysis' or 'forecast sheet' by which you can analyze the data and predict the output.
One such powerful feature provided by excel is Pivot. With the help of pivot, one can analyze millions of data in one sheet and can find meaningful insights.
3. Data Entry:
Millions of customers call the call center in a day, saving the complete details of each customer manually is a tedious and difficult task but it is also necessary to save the customer's data. In such a situation, you need an application where you can add, save and modify the data at required intervals. Microsoft Excel application does the same for you.
Apart from this, Excel spreadsheet is also used to feed data manually, in many institutions or organizations even today some details are fed on paper by the marketing team. And later they have to be saved in such software where they can be accessed for years.
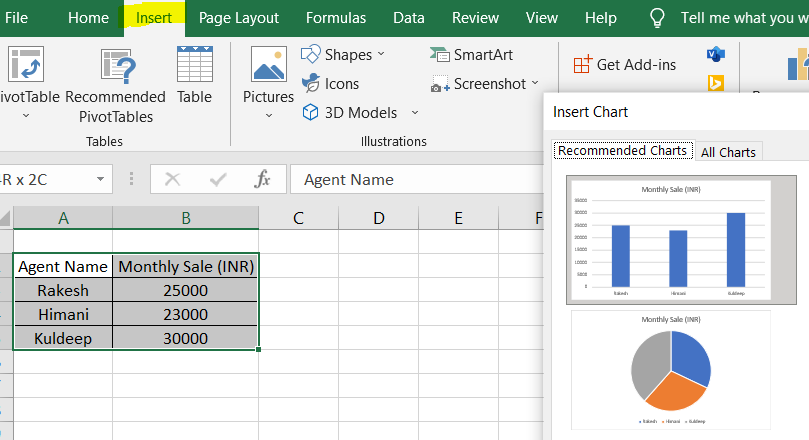
4. Data Visualization:
One of the most underrated features of Excel is that it can also be used as a visualization tool. Sometimes clients or internal stakeholders may ask you to do performance visualization without giving much time, in such a situation choosing Microsoft PowerPoint would be a bad idea, also with the time constraint, preparing visualization on PPT would be difficult.
But the good thing is that Microsoft Excel offers you the facility of data visualization. You just have to select the data and go to the Insert section where there are thousands of data visualization methods available.
5. Programming:
MS Excel can also be used as a programming language. Generally, programming language denotes a language that contains a set of instructions that tells excel to perform the task.
For programming, excel understands the language of VBA i.e Visual Basic for Application. There are 2 ways to write the instruction in VBA. One is directly writing the set of instructions (code) in VBA and the second one is running or recording the Macros. The benefit of recording macros is that it automates recurring tasks.
For example, if you have to prepare a dashboard on daily basis with the same format (borderline, color, font) then with the help of macros you can reduce the mundane task of creating the same dashboard again and again.
Apart from the above-mentioned usage MS excel is also proficient in preparing time management trackers, Finance Analysis, and Accounting. All in all, we can conclude that the excel application is a one-stop shop for every need of an organization.
Having said that, it would not be wrong to say that with the new technology and software developments, the use of excel is decreasing but it seems impossible that it will become obsolete in the future.
Click here to get the latest job updates
Let me know how did you like the article also please do share your views in the comment box.
For more such informative blogs subscribe to our newsletter by entering your mail id.
For any suggestions and queries write us at sarkariprivatejobs2020@gmail.com


0 Comments